The Intermediate Cycle is the dominant weekly cycle shorter than one year. Each market has its own Intermediate Cycle, and the average cycle length ranges from 9 to 22 weeks. A few markets have a smaller sub-cycle called the 1/2 Intermediate Cycle which averages one-half the length of the Intermediate Cycle. The Intermediate Cycle and 1/2 Intermediate Cycle will normally top and bottom with a concurrent Daily Cycle.
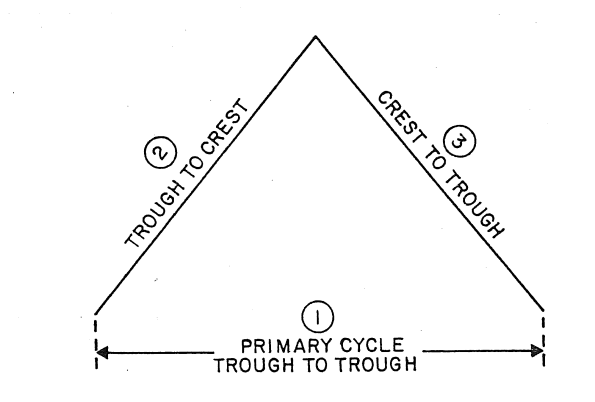
The most consistent aspect of the markets is time, and the Timing Bands for the primary Cycle tops and bottoms indicate when to look for specific patterns in Oscillators that will indicate a cycle top or bottom, or a high probability trade. These intermediate cycles are of two types. The first is a simple up/down move :
The second type is more complex because it has within it a smaller cycle called the 1/2 intermediate cycle that causes the intermediate cycle to have two tops and an intervening low between intermediate Cycle bottoms. The price moves of this 1/2 intermediate cycle are not always large, nor do they occur in every cycle.
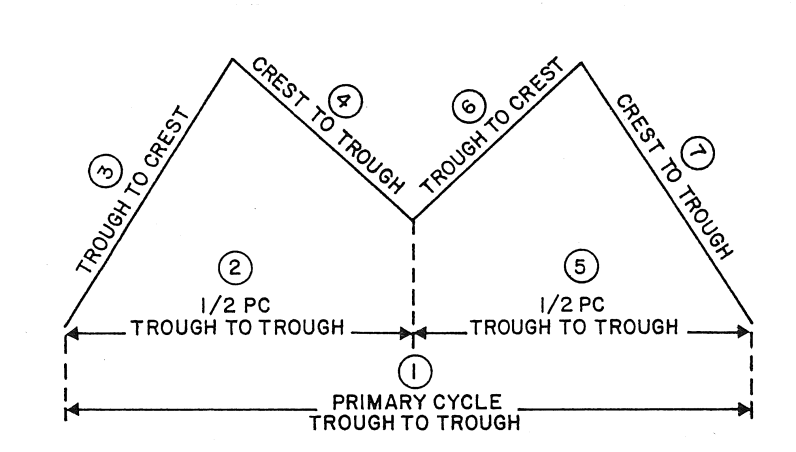
One problem with these measurements is that they do not differentiate between bull and bear markets and as a result the time periods can be very broad, especially the Timing Bands from low-to high and high-to-low. As a general rule, in a bull market, or uptrend, the Trough-to-Crest Band should be from the average to the end of the Timing Band; the Crest-to-Trough Band should be from the beginning of the Timing Band to the average. In a bear market, or downtrend, the T-C Band should be from the beginning of the Timing Band to the average; the C-T Band should be from the average to the end of the Timing Band. For example—In the S&P Index the 1/2 Primary Cycle Trough-to Crest Band is 2-10 weeks with an average of 5. In bull markets use a Timing Band of 5-10 weeks, and in bear markets use a Timing Band of 2-5 weeks. The Crest-to-Trough Band is 1-9 weeks, with an average of 5. In bull markets use a Timing Band of 1-5 weeks, and in bear markets use a Timing Band of 5-9 weeks. These Timing Bands can be plotted on a chart to visually see when to anticipate highs and lows. Cycle highs and lows can be expected to occur within the Timing Bands about 7 out of 10 occurrences. When the oscillators complete the Setup/Trigger patterns within the Timing Bands, a cycle high or low is usually in place. The trough-to-trough and trough-to-crest Timing Bands are counted from the low that begins the cycle. The crest-to-trough Timing Band is counted from the high of the cycle.